Edit chart
Loading graph
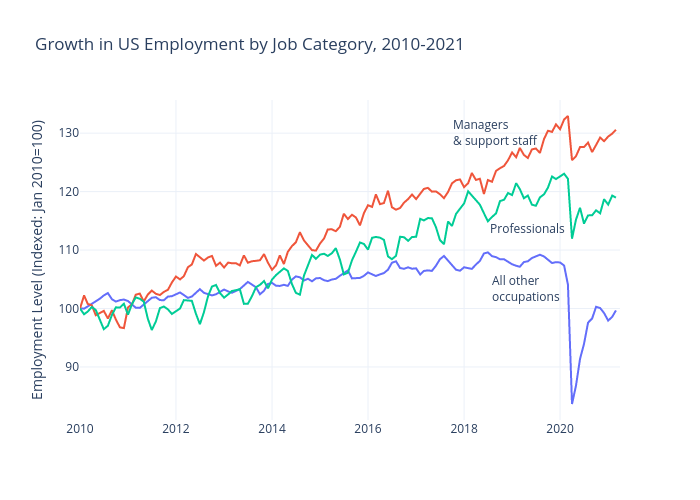
Michelezanini's interactive graph and data of "Growth in US Employment by Job Category, 2010-2021" is a line chart, showing All other occupations, Managers and support staff, Professional occupations; with time in the x-axis and Employment Level (Indexed: Jan 2010=100) in the y-axis.. The x-axis shows values from 2010-01-01 to 2021-04-01 . The y-axis shows values from 80.92387122666666 to 135.66936309333332. This visualization has the following annotations: Managers& support staff; Professionals; All other occupations